When you manage multiple locations, whether it’s 5 pizza franchises, 20 dental offices, or 50 home service contractors. Traditional SEO reports become useless. They tell you: “You rank #3 on Google for ‘plumber near me’ in New York.”
But what about in Park Slope? What about in Midtown? What about in Forest Hills?
That’s where hyperlocal SEO comes in.
In 2024, customers increasingly search location-specific queries. A restaurant customer doesn’t want results from the next county over. They want their neighborhood. And if you’re a multi-location brand, you’re competing for visibility at the hyper-granular level: zipcode, neighborhood, even grid-box level.
This is where most agencies fall short. They optimize for citywide rankings and miss the fact that they’re ranking #1 in one neighborhood but #47 in another, just 3 miles away.
What is Hyperlocal SEO?
Hyperlocal SEO is the practice of optimizing your business to rank for search queries in specific geographic micro-areas, neighborhoods, districts, even street corridors. Instead of optimizing for “coffee shop near me” (city-wide), you optimize for “best coffee shop in Williamsburg” or “coffee on Bedford Ave.”
For multi-location brands, this means:
- Optimizing each location’s Google My Business profile differently
- Building neighborhood-specific citation authority
- Targeting long-tail location modifiers (“open now in SoHo,” “wedding venues in Park Slope”)
- Monitoring rankings across dozens of micro-markets simultaneously
But here’s the problem: traditional SEO tools track rankings at the city level, not the neighborhood level.
The Grid Tracking Revolution
Enter geo-grid tracking a relatively new approach that divides any geographic area into a 10×10 grid and tracks your rankings in each grid square separately. Here’s how it works:
Imagine you overlay a map of Manhattan with a 100-square grid (10 rows, 10 columns). Each square represents roughly a neighborhood or district. Your tracking system now monitors:
- Where you rank for a given keyword in each grid square
- How rankings vary across different neighborhoods
- Which grid squares are your strongest markets
- Which grid squares need optimization
For a pizza chain with 12 NYC locations, you’re no longer asking “Do we rank for ‘pizza delivery near me’?” You’re asking: “Which neighborhoods have strong rankings around each of our locations, and where should we build citation authority?”
The Real-World Impact
Consider a real scenario: A dental practice group with 8 locations across Los Angeles.
Using traditional SEO tracking, they see:
- Average rank for “dentist near me”: #4 in LA
- 12 monthly leads from organic search
But using grid tracking, they discover:
- Strong (#1-3) in grid squares containing 5 of their locations
- Weak (#20+) in grid squares containing 2 locations
- No ranking presence in the grid square where they’re opening their 9th location
This reveals the problem: they’re not evenly dominating their service areas. They’re leaving money on the table.
They then:
- Double down on citations in the weak grid squares (local directories, neighborhood blogs, community sites)
- Optimize the 9th location’s GMB profile using hyperlocal keyword research specific to that neighborhood
- Build location-specific service pages targeting neighborhood-level search intent
Result: Within 3 months, all 8 locations show top-3 rankings in their respective grid squares, and monthly leads jump to 47.
Why Agencies Love Grid Tracking
If you manage clients across multiple locations, grid tracking solves a huge operational problem: How do I prove I’m delivering results at the hyper-local level?
Traditional reporting says: “Your average ranking improved by 1.5 positions.” Clients don’t care about averages. But if you show: “Your flagship location now ranks #1 in 7 out of 10 grid squares nearby, up from 3 out of 10,” they feel the improvement.
For SaaS platforms and agencies managing 50+ locations, grid tracking becomes the foundation of your entire optimization strategy. You can:
- Benchmark performance across neighborhoods and identify underperforming locations
- Allocate resources intelligently (where is the next dollar best spent?)
- Report with granularity (instead of vague averages, show grid-by-grid wins)
- Scale hyperlocal optimization (systematically fix weak grid squares across your entire client portfolio)
How to Implement Grid Tracking
Most DIY solutions fall short. Google Search Console doesn’t offer grid-level data. Traditional SEO tools track at the city or metro level. You need an API-first platform designed for hyperlocal measurement.
The ideal solution:
- Feeds your business coordinates (latitude/longitude) into the system
- Defines a geographic radius and grid size (e.g., “10×10 grid covering a 5-mile radius around each location”)
- Tracks keyword rankings in each grid square daily or weekly
- Returns a visual heatmap showing which grid squares are winning
- Compares your rankings to competitors’ rankings in each grid square
This is what the [LDE Business Scoring API](link to /business-scoring-api/) geogridtracker endpoint does. It:
- Takes your business location and search keywords
- Generates a 10×10 grid overlay
- Runs ranking checks for each grid square
- Returns a JPEG heatmap you can use in client reports or internal dashboards
- Provides JSON data for programmatic analysis
For multi-location franchises and agencies, this becomes your competitive advantage. While your competitors are guessing where to focus, you have data-driven insights into every micro-market.
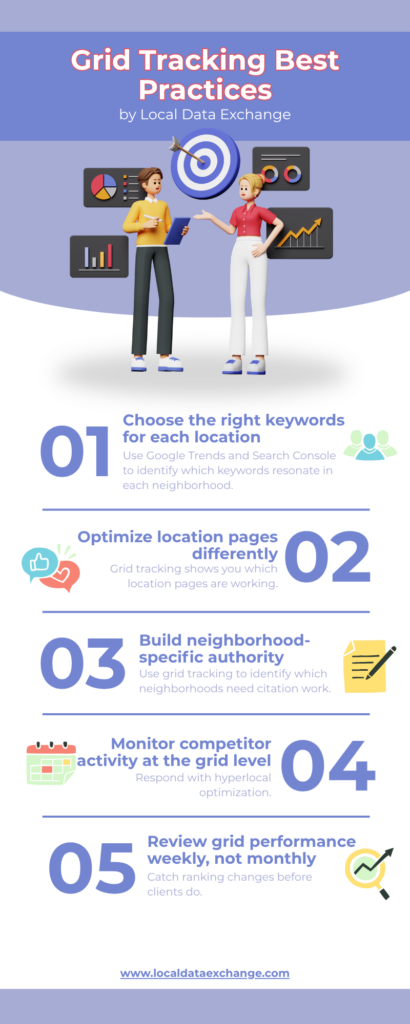
Grid Tracking Best Practices
- Choose the right keywords for each location
Don’t use the same keywords everywhere. A “coffee near me” search in SoHo is different from one in the Upper West Side. Use Google Trends and Search Console to identify which keywords resonate in each neighborhood.
- Optimize location pages differently
Your homepage targets “dentist in LA.” Your Westwood location page targets “dentist in Westwood.” Your Santa Monica page targets “family dentist Santa Monica.” Grid tracking shows you which location pages are working.
- Build neighborhood-specific authority
Citations in local Westwood directories matter more for your Westwood location’s rankings. Use grid tracking to identify which neighborhoods need more citation work.
- Monitor competitor activity at the grid level
If a competitor opens in a previously weak grid square, you see it immediately through ranking drops in that square. Respond with hyperlocal optimization.
- Review grid performance weekly, not monthly
Local rankings move fast. Set up automated weekly grid tracking reports so you catch ranking changes before clients do.
Why Hyperlocal Matters Now More Than Ever
Three trends converge to make hyperlocal SEO critical in 2024-2025:
- “Near me” searches dominate. Google data shows 30%+ of searches include location intent. Users want hyper-relevant results.
- Google’s focus on location quality. Google My Business signals, local citations, and neighborhood-level content ranking matter more than ever.
- Multi-location brands are scaling rapidly. Franchises, chains, and agency clients with dozens of locations are the norm. Citywide averages don’t cut it anymore.
Grid tracking is no longer optional for agencies managing multi-location clients, it’s table stakes.

The Grid Tracking Workflow for Agencies
Here’s how to operationalize grid tracking:
Day 1-2: Setup
- Collect location coordinates for all client locations
- Define keyword sets for each location type (restaurant, dentist, plumber, etc.)
- Set radius and grid size (typically 5-10 mile radius, 10×10 grid)
Week 1: Baseline
- Run your first grid tracking report
- Identify which grid squares are strong (#1-5), fair (#6-20), and weak (#20+)
- Create a “Weak Grid Squares” list—these are your optimization priorities
Week 2-4: Optimization
- For each weak grid square, execute:
- GMB content refresh with neighborhood-specific keywords
- Local citation building in neighborhood directories
- Location page optimization
- Hyperlocal content creation (blog posts about that neighborhood)
Week 5-8: Monitoring
- Re-run grid tracking weekly
- Track which optimization tactics moved the needle
- Replicate winning tactics across other weak grid squares
Month 3+: Scale & Report
- Automate weekly grid tracking reports
- Show clients visual heatmaps of improvement
- Expand to new keywords and locations
Tools & Integration
The [LDE Business Scoring API](link to /business-scoring-api/) is purpose-built for this workflow. The /geogridtracker endpoint:
json
POST /geogridtracker
{
“businessname”: “Downtown Pizza Co”,
“address”: “123 Main St, New York, NY”,
“keywords”: [“pizza delivery near me”, “best pizza in”, “pizza near me”],
“gridsize”: “10×10”,
“radiusmiles”: 7
}
Returns:
json
{
“grids”: [
{
“keyword”: “pizza delivery near me”,
“image”: “https://s3.com/us-west-2/grid-heatmap.jpg”,
“boxes”: [
{
“ranking”: 1,
“topleft”: {“latitude”: 40.7128, “longitude”: -74.0060},
“topright”: {“latitude”: 40.7148, “longitude”: -74.0040},
…
}]}]}
You get:
- JSON data for programmatic analysis (build alerts, dashboards, reports)
- JPEG heatmaps for client presentations (visual proof of dominance)
- Ranking per grid square to pinpoint optimization targets
No more guessing. No more citywide averages. Just precise, actionable hyperlocal data.
Start Your Hyperlocal Domination
If you’re an agency managing multi-location clients, grid tracking is your unfair advantage. Your competitors are still optimizing for city-level rankings. You’re dominating every neighborhood in every market.
Here’s your next step:
- Identify one multi-location client with 3-5 locations
- Run a baseline grid tracking report for one important keyword
- Analyze the weak grid squares and pick 2-3 to optimize
- Re-run the grid tracking in 4 weeks and watch the rankings shift
The LDE Business Scoring API makes this trivial. It’s a single API call to unlock hyperlocal intelligence across all your clients.
Ready to dominate your local markets? Start your free grid tracking audit today.