
You’ve likely heard of geo grid rank tracking, but do you really understand how it works, when to use it, and what it reveals that other tools don’t?
If you are new to geo grids or looking to improve how you use them, this guide answers the top 10 most frequently asked questions about geo grid search tools, straight from industry experience and user insight.
From setup and cost breakdowns to accuracy, competitor insights, and SAB tracking, you’ll walk away knowing exactly how to use geo grid data to drive stronger local rankings and smarter SEO decisions.
Let’s start by saying this tool could also be found as:
Local SERP Grid Tracking, Geo-based Rank Tracking, Grid-based Position Tracking, Local Search Grid Mapping, Geo-Targeted SERP Monitoring, Map Pack Rank Tracking, Local Keyword Grid Tracking, Location-Based Search Visibility, Geo-Rank Heatmap or Proximity Rank Tracking.
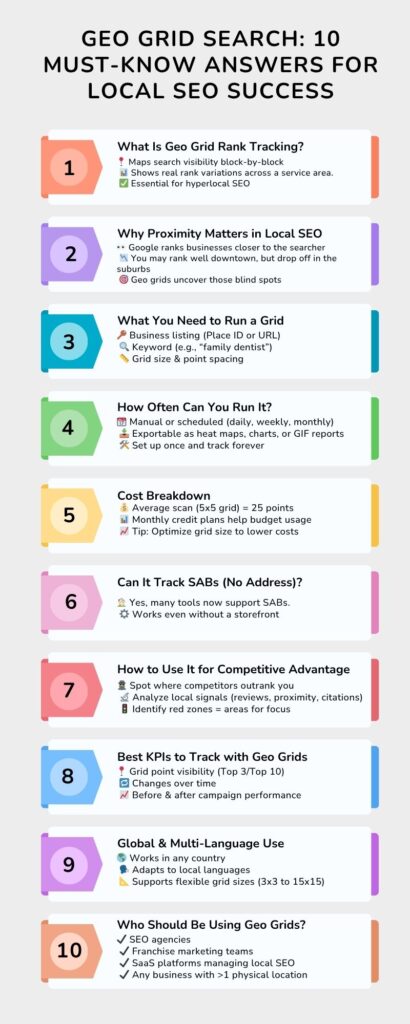
1. What is geo grid rank tracking, and how does it differ from traditional local ranking tracking?
Geo grid rank tracking maps your search visibility at multiple geographic points, blocks or coordinates, across a city or region, rather than measuring from a single location. Traditional trackers show your overall rank (e.g., #3 for “best pizza Chicago”), but geo grids reveal your performance in different neighborhoods and how proximity affects visibility.
2. Why does proximity matter more in local search rankings now?
Google increasingly weighs proximity as a deciding factor in local rankings, especially for “near me” queries. A geo grid exposes these nuances: you may rank high blocks away but drop off further out, making it possible to tailor location-specific optimization more effectively.
We see two types of businesses using listings for SEO. Here you will learn how to choose between Geo Grid API offers.
3. What inputs are required to generate a geo grid?
Most tools require three key inputs:
- Your listing identifier (Place ID, Maps link, or imported profile)
- A target keyword (e.g., “emergency plumber”)
- Grid parameters (size, density, center point). Some systems let you move the grid off-center for custom coverage. Distance between points can be defined in meters or miles.
4. Can geo grids track Service Area Businesses (SABs) without a fixed address?
Yes, many tools support SABs, though some limit this feature in basic modes. For example, Google’s Places API mode only handles visible-address businesses, but providers’ own infrastructure supports SABs. Confirm your platform supports SAB tracking if you serve these businesses.
5. How often can grids be scheduled and how are reports delivered?
Geo grid scans can be run ad‑hoc or scheduled (daily, weekly, monthly). Results are visual: heatmap-style grids, downloadable PDFs or GIF timelapses, and charts illustrating visible rank changes over time. Scheduled reports keep clients updated seamlessly.
6. How can geo grids combine competitor analysis and ranking factors?
Advanced tools show competitor listings at each data point and track ranking signals, such as review count, citation volume, domain authority, and relative map position. This gives immediate insight into why competitors outrank you in specific areas and where to focus your efforts.
7. Is the data reliable? What about differences between tools?
Accuracy depends on the data method. Some platforms use official APIs (Google Places), while others rely on proprietary scraping and GPS-based simulations. Differences in elevation calculations, search center parameters, and scraping methodologies can produce slight result variances. Focus on trends rather than absolute rank numbers, most tools mirror Google results closely.
8. How expensive is a geo grid scan and how do credits work?
Each grid point equals an API call (e.g., a 5×5 grid = 25 calls). When running multiple keywords or geo queries, costs add up. API providers charge per request (~$0.03 each), so a single scan might cost $0.75; with markup, providers may charge $1+ per grid point. Providers sell grid credits in bundles. It’s essential to estimate keyword and grid volume monthly to manage budget. Learn about market prices here.
9. What platforms support global scanning and language adaptation?
Many tools work globally, adjusting to local TLDs and languages automatically. Grid sizes like 3×3, 5×5 up to 15×15 are customizable per region. This lets you measure performance in multilingual markets or across regions from city centers to suburbs.
10. How can agencies best leverage geo grid insights?
Use geo grids to:
- Uncover visibility gaps: find red zones in grid to localize optimization.
- Spot rankings filters: if only central points show up, others might be penalized or suppressed.
- Set client expectations: show hyperlocal performance, not just summarized rankings.
- Demonstrate ROI: visual shift from red to green builds trust and shows impact.
Competitive intelligence: compare where competitors beat you and reverse-engineer ranking signals.
📍 Find the blind spots in your local SEO strategy.
Explore Geo Grid Rank Tracking