One of the most common problems in local SEO is the illusion of strong performance. A business may appear to rank well for key terms, receive positive reports, and still struggle to generate the expected volume of calls, visits, or leads. In many cases, the issue is not overall visibility but where that visibility exists.
Ranking blind spots are areas where a business fails to appear in local search results, even though performance looks healthy elsewhere. These blind spots often go unnoticed because traditional rank tracking relies on averages or single search locations. Geo grid maps expose these gaps by visualizing rankings across real-world locations.
For agencies, SaaS SEO platforms, and multi-location brands, identifying ranking blind spots is critical. These gaps often represent missed revenue, underperforming neighborhoods, and untapped growth opportunities. This article explains how geo grid maps reveal ranking blind spots, why they matter, and how to use them to strengthen local SEO strategy.
What Are Ranking Blind Spots in Local SEO?
Ranking blind spots are geographic areas where a business does not appear prominently in local search results, even though it may rank well elsewhere.
These blind spots often occur when:
- Visibility is strong near the business but weak farther away
- Competitors dominate specific neighborhoods
- Reviews or relevance signals lag behind competitors
- Proximity disadvantages limit exposure
- Listing details are misaligned with local intent
The key challenge is that these blind spots are rarely visible in traditional reports. A business may rank first at one location and completely disappear just a few blocks away. Without geographic measurement, this problem stays hidden.
Why Traditional Rank Tracking Misses Blind Spots
Traditional rank tracking methods were not built to detect geographic gaps.
1. Single-point rankings hide variation
Checking rankings from one assumed location does not represent how customers search across an area.
2. Average rank masks weak zones
Averages blend strong and weak performance together, hiding areas where visibility is poor.
3. City-level tracking ignores neighborhood differences
Local competition often varies by street or district, not by city.
4. Reports do not reflect real search behavior
Users search from their current location, not from a central testing point.
Because of these limitations, blind spots can persist for months without detection.
How Geo Grid Maps Reveal Ranking Blind Spots
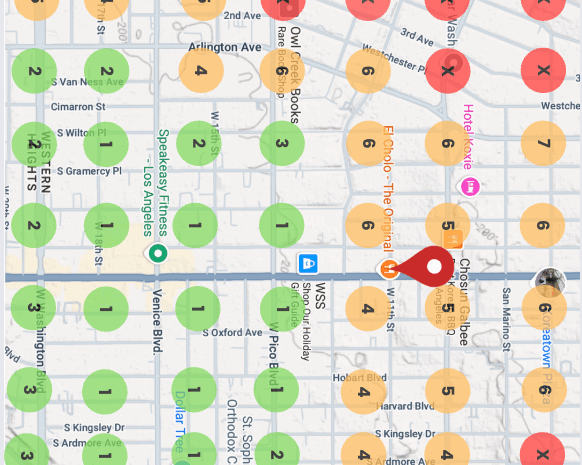
Geo grid maps measure rankings from multiple real-world locations around a business and display them visually on a map.
Instead of a single number, you see a pattern of visibility.
Geo grids reveal:
- Where rankings are consistently strong
- Where visibility drops off sharply
- Which neighborhoods competitors dominate
- How proximity affects exposure
- Whether improvements are expanding coverage or just reinforcing core areas
Blind spots stand out clearly as clusters of low-ranking or no-ranking points on the grid.
Common Types of Ranking Blind Spots Geo Grids Uncover
1. Distance-based blind spots
Many businesses rank well close to their location but lose visibility quickly as distance increases. Geo grids make these boundaries visible.
2. Competitive blind spots
Some neighborhoods are controlled by competitors with stronger reviews, relevance, or proximity. These areas often appear as persistent low-visibility zones.
3. Category mismatch blind spots
If a business category does not align well with search intent in certain areas, geo grids may reveal weak visibility even when proximity is favorable.
4. Reputation-driven blind spots
In dense markets, slight differences in review quality can cause major visibility shifts. Geo grids often highlight these gaps.
5. Service-area blind spots
For service-area businesses, geo grids can reveal areas that should be reachable but are not ranking due to configuration or relevance issues.
How Agencies and Brands Use Geo Grids to Diagnose Blind Spots
Geo grid analysis typically follows a structured approach.
1. Establish a baseline grid
Teams start by capturing a geo grid snapshot before optimization. This establishes where visibility exists and where blind spots appear.
2. Identify consistent low-visibility clusters
Rather than focusing on individual points, teams look for patterns. Clusters of weak rankings indicate true blind spots.
3. Compare against competitors
Overlaying competitor performance helps determine whether blind spots are caused by proximity limits or competitive pressure.
4. Assess local signals in weak zones
Teams review reviews, categories, content, and listing accuracy for patterns that explain weak performance.
5. Prioritize blind spots by business impact
Not all blind spots matter equally. High-traffic areas or revenue-driving neighborhoods usually receive priority.
How Geo Grid Blind Spots Inform Optimization Strategy
Once blind spots are identified, geo grid data guides targeted action.
Targeted listing optimization
Weak zones often benefit from improved categories, attributes, or service descriptions aligned with local intent.
Focused review generation
Geo grids frequently show that reviews influence rankings most in competitive neighborhoods.
Localized content improvements
Content can be tailored to specific areas where relevance is weak.
Paid support where organic reach is limited
Geo grids help identify where paid ads can supplement organic gaps efficiently.
Expectation management
Some blind spots are limited by proximity and cannot be fully eliminated. Geo grids help set realistic goals.
Why Identifying Blind Spots Is Critical for Multi-Location SEO
Blind spots become more damaging at scale.
For multi-location brands:
- Averages hide underperforming locations
- Strong markets mask weak ones
- Reporting fails to reflect local reality
Geo grids allow brands to:
- Detect blind spots at the location level
- Compare performance fairly across markets
- Identify regional trends
- Support franchise accountability
- Scale optimization without guesswork
This precision is impossible with traditional rank tracking alone.
Using Geo Grid Maps to Track Blind Spot Progress Over Time
Geo grids are not just diagnostic tools. They are powerful tracking instruments.
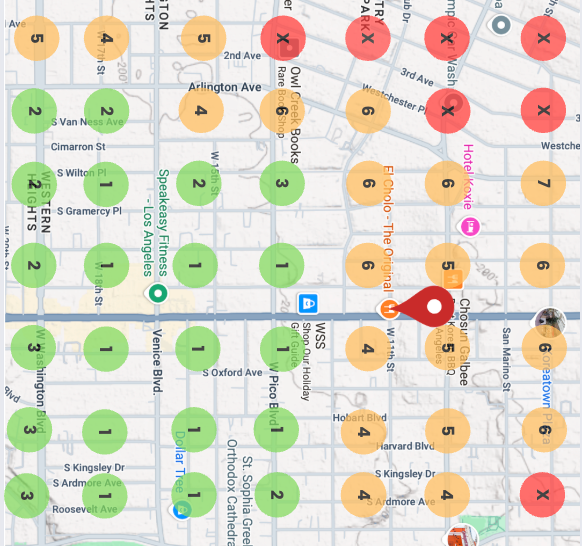
By comparing grids over time, teams can see:
- Whether blind spots are shrinking
- Whether visibility is expanding into new areas
- Whether improvements are limited to core zones
- Whether competitors are losing ground
Progress becomes visual and measurable.
Why Blind Spots Matter More Than Rankings Alone
A business does not need to rank everywhere to succeed. It needs to rank where customers are.
Blind spots often explain:
- Why call volume does not match ranking reports
- Why foot traffic underperforms expectations
- Why certain neighborhoods never generate leads
Geo grid maps connect SEO performance to real-world exposure.
Best Practices for Using Geo Grid Maps to Find Blind Spots
Successful teams follow a few key principles.
- Use consistent grid sizes for comparisons
- Focus on patterns, not individual points
- Pair grid data with local context
- Avoid chasing blind spots limited by distance alone
- Prioritize areas tied to revenue and demand
When used correctly, geo grids become one of the most powerful tools in local SEO.
Ranking blind spots are one of the most overlooked issues in local SEO. They hide behind averages, single-point rankings, and city-level reports. Geo grid maps bring these blind spots into clear focus by showing where visibility truly exists and where it does not.
For agencies, SaaS platforms, and multi-location brands, identifying blind spots is essential for improving performance, proving ROI, and aligning strategy with real search behavior. Geo grid maps provide the clarity needed to move beyond assumptions and optimize where it matters most.
Local SEO success is not about ranking somewhere. It is about being visible in the right places. Geo grid maps make those places visible. Test LDE’s APIs here: https://www.localdataexchange.com/